Purpose
The next stage is to calculate both trends and trend classes for easy interpretation. Vegetation classes can jump around, especially on the edges of mangroves, however trends give a better longer term perspective on what changes are occurring. The raster outputs can be used to spatially visualise where change is occurring and will later be used as inputs to calculate areas.
Use the trend_class() function
The trend_class() function will perform a per pixel
linear regression and then classify the values into 5 bins which
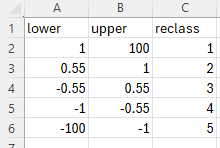
correspond to the trend classes; major gain (1), minor gain (2), stable
(3), minor loss (4) and major loss (5).
The bins are drawn from the
supplementary/trend_classes.csv and like other
supplementary data should be checked for validity for your area of
interest. The trend class bins look like the below.
# The general form of the function is (NOTE the default parameters)
# trend_class(irast, areaname, end, period = 10, classes = "supplementary/trend_classes.csv", ext = ".tif")

# We  need to assign three of the parameters as the other defaults are fine
irast <- "veg_dens_mskd_cld"
areaname <- "lgcsmp_lsat"
end <- 2023

# Run the function
trend_class(irast, areaname, end = 2023)
irast - input vegetation density directory.
areaname - a geographical area or marine park name for the output rasters.
end - the end year of the time series to consider (usually the latest).
What’s going to happen?
Two rasters are going to be created. One will be to show the per pixel result of the regression. The second will be the same data but reclassed according to the trend class bins in the supplementary csv.
NOTE on regression time periods The default period for the regressions is 10 years and any missing years will be buffered (dummy year inserted). The user can choose any period but no less than 3. Be aware though that identical slope values over different period lengths can equate to drastically different amounts of absolute change. The classification bins shipped with the data have been determined for a 10 year period and will be either too sensitive or not sensitive enough to other period lengths.
NOTE on cloud handling in regressions If pixels have been encoded as cloud, the value is swapped to NA as any numerical value will adversely affect the regression.