Purpose
Over time area of mangroves increase and decrease in response to various drivers such as new habitat creation and cyclone activity amongst others. This function calculates change between all consecutive vegetation classification rasters. It then outputs extent change area statistics as well as extent change shapefiles to visualise where change has occurred.
Use the extent_change() function
The extent_change() function compares all the vegetation
classification rasters previously created by running
veg_class(), calculates change in area and also outputs
shapefiles to spatially show where change is occurring. There are six
categories reported on; loss, gain, stable and their cloudy probability
equivalents.
In order to report effectively, a region needs to be delineated. This
boundary needs to be supplied in a shapefile. Convention has it that an
attribute column, named “region” contains a region name and a site name
separated by an underscore. An example might be “lgscmp_east”,
“lgscmp_west” etc. This should be the same shapefile that was used when
running the veg_class_area() and/or the
trend_class_area().
# The general form of the function is (NOTE there are no default parameters)
# extent_change(irast, iregions, areaname, attribname)

# We  need to assign all four of the parameters
irast <- "veg_class"
areaname <- "lgcsmp_lsat"
iregions <- "vectors/regions.shp"
attribname <- "regions"

# Run the function
extent_change(irast, areaname, iregions, attribname)
irast - input vegetation classification directory.
areaname - a geographical area or marine park name for the output csv.
iregions - file path to a shapefile denoting the reporting region.
attribname - the name of the attribute column containing region information.
What’s going to happen?
A csv of areas in hectares will be output to the
extent_change\ directory and will look similar to this.
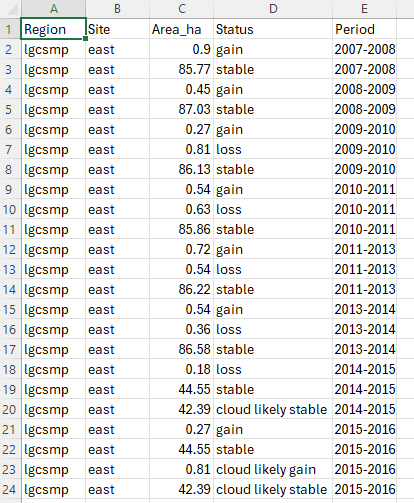
Note that change between consecutive years is calculated and in the example there are some cloudy years.
Shapefiles are also created for each comparison year/site
combination. All are written to the extent_change\
directory.