Introduction
The following articles or vignettes are intended to provide an
example of how to process index rasters through to final analysis
products. They are designed to be helpful and to get a user started.
They do not however contain all the information about
groveR's functions as there is comprehensive help available
in two places.
The first and perhaps easiest place to look for detailed information
on any of the functions is under the Reference tab on
groveR's website.
The second is through a search in the Help tab in
RStudio or by typing??NameOfFunction in the R console which will return
familiar R documentation help (provided you have loaded the
groveR package).
Purpose
This is where the processing really begins. A vegetation index will be converted to a cover metric which will make all outputs more meaningful. There will have been a lot of work done prior to this stage. Field measures of cover will have been regressed with a variety of vegetation indices to find the best relationship. That work will have resulted in an index being chosen for the annual data plus model coefficients being recorded in the calibration csv file.
Calibration file
This csv file holds the model coefficients that when applied to the
index rasters, will convert them to a measure of cover. It should be
located in the Processing Folder in
supplementary/. The csv needs to have the following
format:
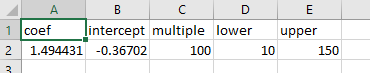
Please ensure the column names are as indicated above. The names mean:
coef - the model coefficient.
intercept - the model intercept.
multiple - a multiple to turn the model output to a percentage.
lower - a lower limit to apply to the veg density. In this instance we are not interested in densities below 10%.
upper - an upper limit to apply to the veg density.
Use the veg_dens() function
Lets run the veg_dens() function. The following code
block uses the data we have set up previously. If using your own data
change the parameters to suit. Below I assign all the parameters to
variables and pass those to the function. I find this neater and will do
this in the remaining vignettes. Alternatively you can input the
parameters directly to the function.
# The general form of the function is (NOTE the default parameters)
# veg_dens(irast, areaname, ext = ".tif", calibration = "supplementary/calibration.csv")

# We only need to assign the first 2 parameters as the defaults are fine
irast <- "index_rasters"
areaname <- "lgcsmp_lsat"

# Run the function
veg_dens(irast, areaname)- irast - input index rasters directory.
- areaname - a geographical area or marine park name that will be pre-pended to the output file names.