Purpose
The best way to get a handle on this package is to try it out with the example data. The following will guide you through putting the example data into the suggested Processing Folder directory.
Populate with data
At this point either fill the directories with the example data or if you are an old hand at this, use your own data. If using your own data you can skip this bit and start the next vignette.
So at this stage you have the initial folders setup. Run the following code to save the example data to where it needs to be.
# Access internal dummy user data and write to sub-directories
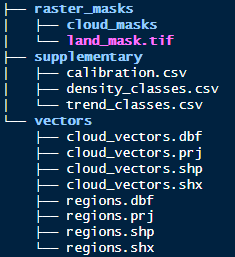
make_example_data(p = ".")After running that your directories should look like this:
Example index data
Often the starting index raster data wouldn’t be stored within the
Processing Folder as it would be large and the result
of other processing steps, such as mosaicking. For the purposes of
demonstration, however, we will store the example index raster here.
Note the code below will also create a folder,
index_rasters/.
# Access internal dummy index data and write to sub-directory
make_index_rasters(p = ".")
After running that your directories should look like this:
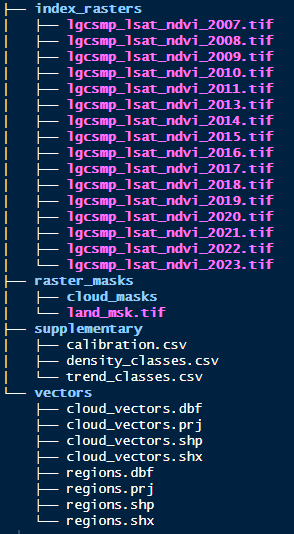
What have we got?
The index raster data is a small subset in area and time (2007-2023) from a monitoring program in Lalang-Garram Camden Sound Marine Park in the Kimberley region Western Australia. Data for 2012 is purposefully missing to demonstrate some behaviours (more on this later) and is in tif format. Note that tif format is preferred but functions do allow for other formats.
There is also a land mask.
In the supplementary directory is a calibration file (model coefficients) to transform the index to vegetation densities. There are also density and trend class csv files to provide bins for classification.
Lastly there are a couple of shapefiles in the vectors directory. One provides boundaries for both a fictitious reporting region and some sites within it. The other provides ficticious digitised clouds which will be converted later to cloud masks.
NOTE on naming. The functions in groveR
will consistently name each interim product based on user provided
parameters (function specific) and a 4 digit year which must be part of
the index image name. Please do not include other numbers in your naming
convention. Something simple like the example data is recommended.
NOTE on supplementary data. The supplementary data shipped with the package, whilst a good start for mangrove analysis, may not be the most applicable to your area of interest. Always check with Kathy Murray from the RSSA Program before running on your area of interest. If you are starting a new area of study where no work has been done before, please use these supplementary csv files as a guide. The format and column headings are important.