Introduction
These functions have been created to aid in compiling the HAB reports by creating a conditionally formatted table in pptx format.
Stage One - Create summary data
Phytoplankton count data in its raw form (hereafter called raw data) provides count and other information for a multitude of species. This data is analysed and provided to us by the Department of Water and Environmental Regulation’s Phytoplankton Ecology Unit. In order to compile the HAB report the data needs to be summarised to reflect only HAB related data. This first stage undertakes this process and outputs summaries that are used in stage two.
An important parameter for these functions is the “mngt_response_triggers” csv. This is a csv file containing a table that reflects current summary groups, included species and trigger threshold values for the HAB report. This information not only guides the summary but its layout also guides the final format of the output pptx file. Below is an example.
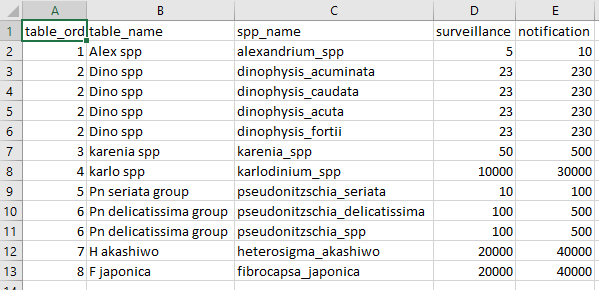
The table variables are:
-
table_ordthis is the ordering of thetable_namegroupings as they will appear in the final output. Each unique group must have its owntable_ordnumber. -
table_namethis is a broad grouping to which individual species will be assigned to. Multiple species can be assigned to a single group. Thistable_namereflects exactly the desired format for the output pptx file. -
spp_namethis is the species names and should follow the same format, i.e. snake_case. Make sure the spelling is as is reported in the raw phytoplankton data. -
surveillanceany value equal to this number and less than or equal to thenotificationvalue will be classified as “surveillance” and coloured orange in the output pptx file. -
notificationany value greater than this will be classified as “notification” and will be coloured red in the output pptx file.
To make things easier to setup, the rivRmon package
comes with an example. This can be read in, adjusted accordingly to
reflect current trigger species and thresholds and then saved to csv for
later use. To do this follow the example below.
#load the package
library(rivRmon)

#assign the internal data to an object called triggers
triggers <- mngt_response_triggers

#you can then save straight to csv and edit as you would an excel file
readr::write_csv(triggers, path = "C:/some_file/path")
After making sure you have access to either the current management
trigger info, or have created your own, you need to supply two file
paths. One to the raw data xlsx spreadsheets and a file path to the
desired location of the exported summary data. This summary data will be
written to a HAB_tables/ directory and if it doesn’t
already exist it will be created. Your next function call should look
something like the below.
#run the hab_groupR function
hab_groupR(pathin = "C:/path/to/raw_data", pathout = "C:/path/for_export",
           mngt_triggers = "C:/path/to/trigger/data")
The only thing to be careful of is ensuring that if you are copying a fiile path from a Windows OS you will need to double all the backslashes for the path to be recognised. The above example is the alternative method where the backslashes are converted to a single forward slash.
Lastly there are two parameters that have default values.
-
skipdefaults to 5. The format of the raw data has 5 lines of unrequired metadata at the top. If the format changes this can be changed too. -
shellrefers to a possible new site on the Canning River. The default for this is FALSE. If this site becomes a permanent addtion to the monitoring then changing this value to TRUE will ensure this site is reflected in the summaries and output pptx file.
Stage Two - Creating the conditionally formatted pptx file
This next stage reads in all the summary HAB data csv’s and based on the date provided, generates a table containing the current and prior week’s cell counts for the groupings indicated in the trigger data with conditionally coloured text to indicate classification.
To accomplish this, run code similar to the below.
#run the hab_tablR function
hab_tablR(hab_tables = "C:/path/to/HAB_tables", date = "20190715",
          mngt_triggers = "C:/path/to/trigger/data")
The hab_tables = input for the hab_tablR()
function is a file path to the location of the HAB_tables/
directory not the summary csv’s themselves. This is essentially the
pathout parameter that you specified when running
hab_groupR(). Note that the format for the date is
“yyyymmdd” and can be presented as above in the code snippet or contain
separators (e.g. “2019/07/15” or “2019-07-15”).
The output will be a single page of a PowerPoint with a table of different coloured counts per site (depending on the river). This table can be then either incorporated into an existing report and formatted for page size and any other tweaks or values can be copied out and put into a “pre-formatted” table.